- Add new API wasm_runtime_load_ex() in wasm_export.h and wasm_module_new_ex in wasm_c_api.h - Put aot_create_perf_map() into a separated file aot_perf_map.c - In perf.map, function names include user specified module name - Enhance the script to help flamegraph generations |
||
|---|---|---|
| .. | ||
| cmake | ||
| host | ||
| pics | ||
| wasm | ||
| CMakeLists.txt | ||
| README.md | ||
linux perf sample introduction
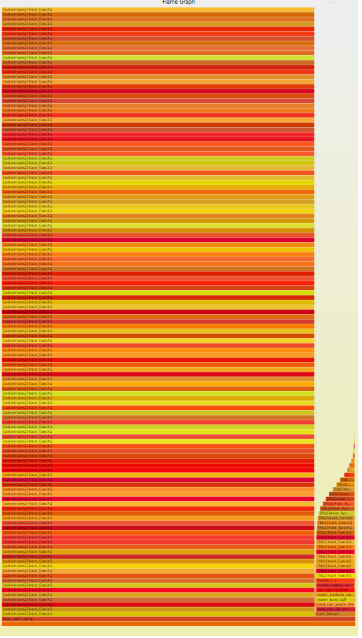
This is a sample to show how to use the Linux perf tool to profile the execution of a WebAssembly application. And how to use the Flamegraph tool to visualize the profiling result.
Build and run the sample
There are two Wasm modules and their instance will be created and run in the sample. The first module is a simple Wasm module that calculates the Fibonacci number. The second module is a simple Wasm module that execute the Ackermann function. The target is enable to profile the execution of both two modules separately.
$ cmake -S . -B build
$ cmake --build build
Profile the execution
$ cd build
$ perf record -k mono -g --output=perf.data -- ./linux_perf_sample
Enable to use perf report --stdio to do a quick analysis of the profiling result.
Visualize the profiling result
Need to download Flamegraph tool from Flamegraph firstly.
$ perf script > out.perf
$ ./FlameGraph/stackcollapse-perf.pl out.perf > out.folded
$ ./FlameGraph/flamegraph.pl out.folded > perf.svg
In this result, you'll see two modules's profiling result and all wasm functions are named as "aot_func#N" which is a little hard to distinguish.
Separate profiling result
process_folded_data.py is a script can a) translate "aot_func#N" into its original function name in name sections, b) separate the profiling result of different modules.
In this sample, we want to separate fib and ackermann profiling data from out.folded. In demo, we decide to name the module of fib1.wasm as fib2 and the module of ackermann1.wasm as ackermann2.
$ python process_folded_data.py --wabt_home /opt/wabt --wasm_names fib2=./fib1.wasm,ackermann2=./ackermann1.wasm out.folded
-> write into out.fib2.translated
-> write into out.ackermann2.translated
-> write into out.translated
More scenarios:
if only using one wasm during profiling, the script can be used like this:
$ python process_folded_data.py --wabt_home /opt/wabt --wasm <wasm_file> --folded <folded_file>
if only using one wasm during profiling and specify the module name via APIs, the script can be used like this:
$ python process_folded_data.py --wabt_home /opt/wabt --wasm_names <module name>=<wasm_file> --folded <folded_file>
if only using one wasm during profiling and specify the module name, which is same with the basename of wasm file, via APIs, the script can be used like this:
$ python process_folded_data.py --wabt_home /opt/wabt --wasm <wasm_file> --folded <folded_file>
if using multiple wasm during profiling and specify module names, which are same with basename of wasm files, via APIs, the script can be used like this:
$ python process_folded_data.py --wabt_home /opt/wabt --wasm <wasm_file> --wasm <wasm_file> --wasm <wasm_file> --folded <folded_file>
if using multiple wasm during profiling and specify module names via APIs, the script can be used like this:
$ python process_folded_data.py --wabt_home /opt/wabt --wasm_names <module_name>=<wasm_file>,<module_name>=<wasm_file>,<module_name>=<wasm_file> --folded <folded_file>
Now we have two flame-graphs for two wasm modules:

